Loading market data...
The valuation gap between US and Indian equity markets in 2026 is shaping global allocation strategies. While US indices like the S&P 500 and Nasdaq trade at premium P/E multiples supported by AI-led profitability, Indian benchmarks such as Nifty 50 and Sensex offer relatively moderate valuations with stronger forward EPS growth projections. Return on equity trends are improving in India’s banking sector, while US large-cap tech maintains margin dominance. Investors are increasingly evaluating diversification through ETFs, balancing currency exposure, earnings visibility, and valuation sustainability to optimize risk-adjusted returns in a shifting macro environment.
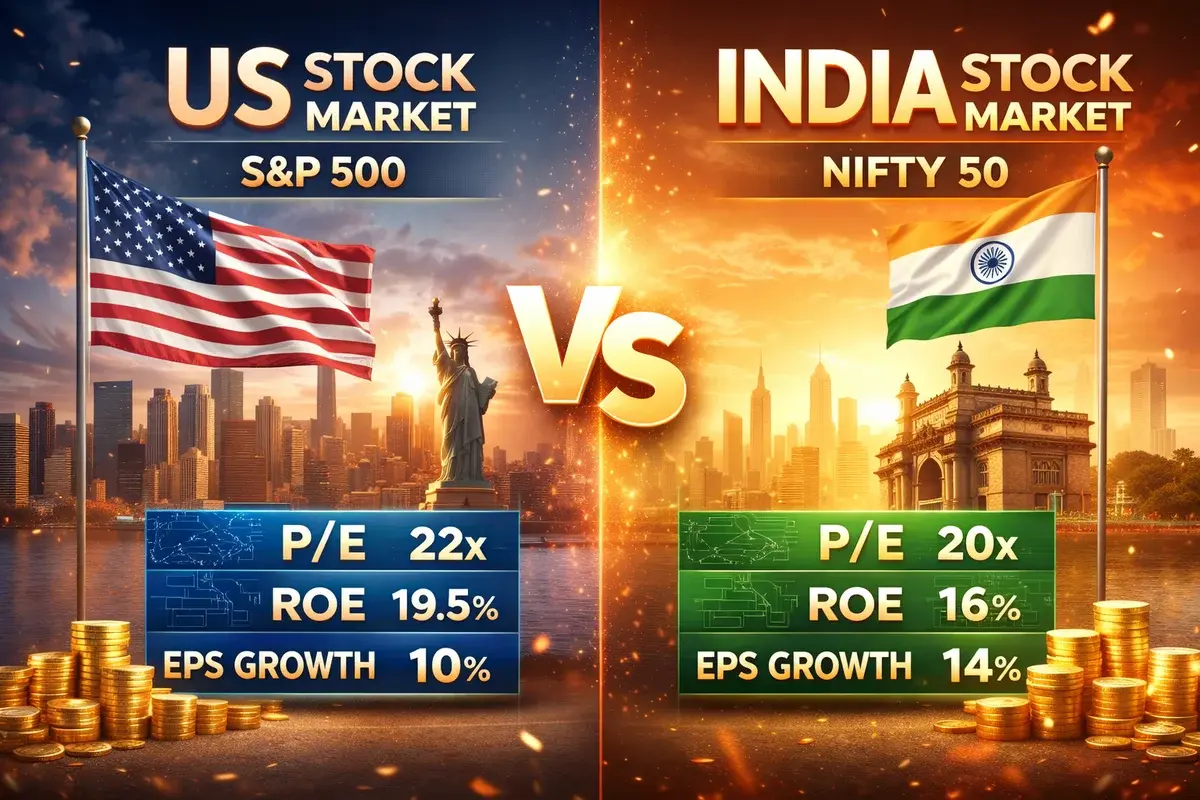
With US markets trading at premium multiples and Indian equities showing stronger forward EPS growth momentum, global investors are reassessing capital allocation strategies for 2026. The debate is no longer about past performance — it is about valuation sustainability, earnings visibility, sector concentration, currency dynamics, and risk-adjusted return potential. This comparative analysis of US and Indian benchmarks examines P/E ratios, ROE trends, EPS growth forecasts, leading stock drivers, and ETF exposure options shaping global portfolios.
| Metric | S&P 500 | Nasdaq Composite | NIFTY 50 | BSE Sensex |
|---|---|---|---|---|
| Forward P/E | 22–24x | 25–28x | 19–21x | 20–22x |
| Trailing P/E | 24–26x | 28–30x | 21–23x | 22–24x |
| ROE | 18–20% | 20%+ | 15–17% | 16–18% |
| FY Forward EPS Growth | 9–11% | 11–13% | 12–15% | 11–14% |
Consensus-based aggregated estimates for 2026.
US benchmarks such as the S&P 500 and Nasdaq Composite continue to reflect AI-led optimism. Meanwhile, India’s NIFTY 50 and BSE Sensex trade at comparatively moderated valuations.
The S&P 500 and Nasdaq Composite remain driven by mega-cap concentration.
These companies account for a significant portion of index earnings growth and ROE superiority.
| Metric | Large-Cap US Tech |
|---|---|
| Net Margins | 20–35% |
| Free Cash Flow | Strong |
| Balance Sheet | Cash-rich |
| R&D Intensity | High |
However, elevated P/E multiples leave limited room for valuation expansion if earnings growth moderates.
Indian benchmarks NIFTY 50 and BSE Sensex reflect banking-led earnings normalization and infrastructure-driven expansion.
| Metric | India Large Caps |
|---|---|
| Net Interest Margins | Stable |
| ROE Trend | Improving |
| Capex Cycle | Expanding |
| Earnings Visibility | Strengthening |
India’s forward EPS growth is projected to outpace US growth rates, supported by domestic liquidity and structural reforms.
| Factor | US Market | Indian Market |
|---|---|---|
| Valuation Premium | High | Moderate |
| Earnings Growth | Stable | Accelerating |
| Sector Concentration | Tech-heavy | Financial-heavy |
| Domestic Liquidity | Moderate | Strong |
| FPI Sensitivity | Lower | Moderate |
The narrowing valuation spread suggests allocation decisions should be driven by forward earnings sustainability rather than historical returns.
US companies benefit from asset-light, margin-rich business models. India’s ROE trajectory is improving as banks complete balance sheet repair and credit growth strengthens.
The ROE differential is no longer structurally wide.
Investors allocating between US and Indian equities must evaluate:
Currency-adjusted returns may alter comparative performance.
For investors preferring passive allocation, ETFs provide diversified access.
| Category | US ETFs | India ETFs |
|---|---|---|
| Expense Ratio | Low to Moderate | Low |
| Liquidity | Very High | High |
| Sector Weight | Tech-heavy | Financial-heavy |
| Currency Risk | USD exposure | INR exposure |
ETF selection depends on risk tolerance, currency preference, and geographic diversification goals.
| Scenario | US Market Impact | India Market Impact |
|---|---|---|
| AI Earnings Outperformance | Sustained multiples | Limited correlation |
| Tech Valuation Correction | Multiple compression | Relative resilience |
| Global Rate Cuts | Expansion support | FPI inflow acceleration |
| Dollar Weakness | Neutral | Positive for emerging markets |
Diversification mitigates scenario concentration risk.
| Asset Class | Suggested Allocation |
|---|---|
| US Equities | 40–50% |
| Indian Equities | 30–40% |
| Global ETFs | 10% |
| Fixed Income | 10–15% |
Blended exposure balances valuation premium risk with structural growth capture.
The US remains a profitability leader supported by innovation dominance and global capital flows. India offers accelerating earnings growth, demographic advantage, and improving capital efficiency at comparatively moderated valuations.
The allocation decision should not be framed as US versus India. It should be framed as a calibrated mix based on valuation discipline, earnings visibility, macro stability, and currency exposure.
Diversification, sector balance, and forward earnings sustainability will define portfolio performance in 2026.
Disclaimer: This article is for informational purposes only and does not constitute investment advice.

Financial journalist specializing in market analysis, stock research, and investment trends. Dedicated to providing accurate, timely insights for informed decision-making.
Credentials: Experienced financial journalist with expertise in equity markets and economic analysis
The information provided in this article is for educational and informational purposes only and should not be construed as financial, investment, or legal advice. Finscann does not provide personalized investment recommendations.
For detailed terms and conditions, please read our Disclaimer and Terms of Service.

Olectra Greentech shares jump 4% after securing a ₹1,800 crore order for 1,085 electric buses.

Hindustan Aeronautics Ltd. Update Hindustan Aeronautics Ltd. (HAL) shares opened higher, breaking a two-day losing streak, as CLSA maintains an...

A ₹1,000-crore small-cap is transitioning from cables to advanced railway signalling under India’s Kavach rollout.

Metal stocks rally as Nifty Metal jumps 7.6% in February. Tata Steel, Adani Enterprises, Jindal Steel, and Lloyds Metals gain up to 13% amid weak...

Waaree Energies and Premier Energies shares drop up to 15% after the US sets a 126% duty on Indian solar imports.